Image Details
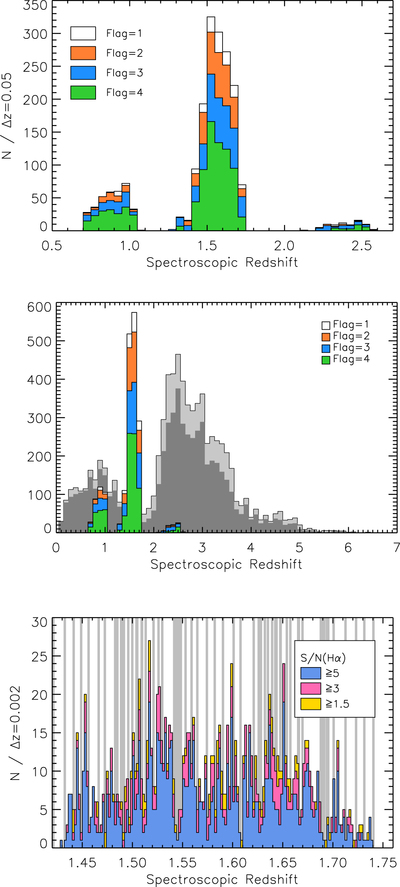
Caption: Figure 10.
Distribution of spectroscopic redshift measurements for all objects in the full FMOS-COSMOS catalog, split by their quality flags. The FMOS zspec distribution is compared with VUDS (Le Fèvre et al. 2015; gray histograms) in the middle panel. The bottom panel shows a zoom-in of the range 1.42 ≤ z ≤ 1.76 with a finer bin size (Δz = 0.002) for objects with an Hα detection in the H-long band. Histograms are color-coded by ﹩{\rm{S}}/{\rm{N}}({\rm{H}}\alpha )﹩ as labeled. The gray stripes indicate the positions of the OH airglow lines, which are converted to redshift with the wavelength of Hα.
Other Images in This Article


Show More
Copyright and Terms & Conditions
© 2019. The American Astronomical Society. All rights reserved.
Copyright ©
2025 Astronomy Image Explorer. All Rights Reserved.