Image Details
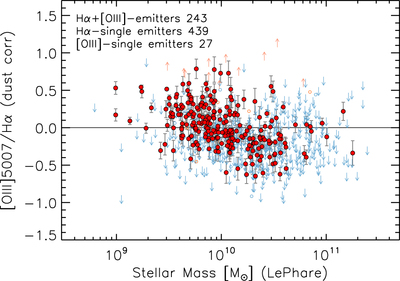
Caption: Figure 41.
Dust-corrected [O III]/Hα ratio as a function of M*. Red circles indicate 261 objects in the Hα+[O III]-emitter sample (Hα at ≥3σ and [O III] at ≥1.5σ), and downward arrows indicate the upper limits for 416 Hα single emitters (≥3σ, but only upper limits on the [O III] flux).
Other Images in This Article


Show More
Copyright and Terms & Conditions
© 2019. The American Astronomical Society. All rights reserved.
Copyright ©
2025 Astronomy Image Explorer. All Rights Reserved.