Image Details
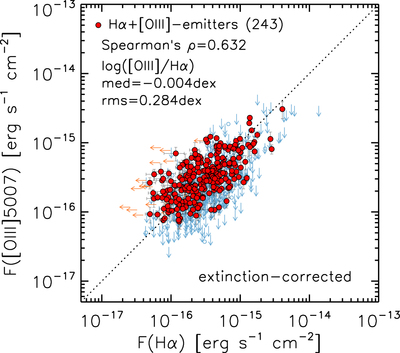
Caption: Figure 40.
Correlation between Hα and [O III] λ5007 fluxes after correcting for dust extinction (both corrected for aperture loss). Red circles indicate 243 objects in the Hα+[O III]-emitter sample (Hα at ≥3σ and [O III] at ≥3σ). The Hα single emitters are shown with blue circles (﹩1.5\leqslant {\rm{S}}/{\rm{N}}([{\rm{O}}\,{\rm{III}}])\lt 3﹩) or downward arrows (2σ upper limits). The [O III] single emitters are shown with orange circles (1.5 ≤ S/N(Hα) < 3) or leftward arrows (2σ upper limits). The dotted line indicates a one-to-one relation.
Other Images in This Article


Show More
Copyright and Terms & Conditions
© 2019. The American Astronomical Society. All rights reserved.
Copyright ©
2025 Astronomy Image Explorer. All Rights Reserved.