Image Details
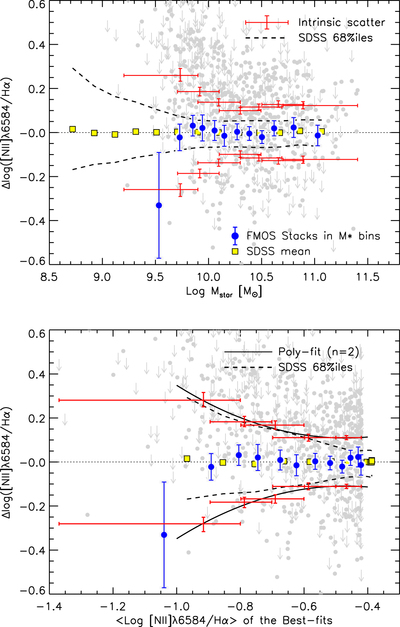
Caption: Figure 39.
Upper panel: [N II]/Hα ratio normalized by the best-fit M*–[N II]/Hα relation as a function of M*. The FMOS objects are shown by gray circles and downward arrows (upper limits). Red error bars mark the estimated intrinsic scatter in overlapping M* bins: the vertical bars indicate the central 68% confidence levels at the median M* values, and the horizontal bars indicate the widths of the M* bins. The black dashed lines indicate the central 68th percentiles of the individual SDSS galaxies in bins of M*. Lower panel: same as upper panel but for Δlog [N II]/Hα as a function of N2(M*), i.e., the “best-fit” [N II]/Hα ratio at given M*, which is taken from the best-fit relation at a given stellar mass for the FMOS and SDSS samples each. The solid curves indicate a second-order polynomial fit to the σint estimates of the FMOS sample.
Other Images in This Article


Show More
Copyright and Terms & Conditions
© 2019. The American Astronomical Society. All rights reserved.