Image Details
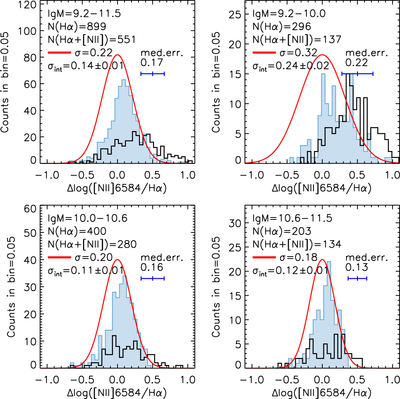
Caption: Figure 38.
Distribution of the [N II] λ6584/Hα ratios normalized to the best-fit relation at a given M*. Objects in the FMOS Sample-H, having both Hα and [N II] detections, are shown by filled histograms in four ranges of stellar mass: log M*/M⊙ = [9.2:11.5] (upper left), [9.2:10.0] (upper right), [10.0:10.6] (lower left), and [10.6:11.5] (lower right). Black open histograms indicate the distribution of upper limits. The numbers of all Hα-detected galaxies (regardless of [N II] detection; N(Hα)) and those with both Hα and [N II] detections (N(Hα + [N II])) within the mass ranges are given in each panel. The red curve indicates a zero-mean normal function with a broadened standard deviation of ﹩\sigma =\sqrt{{\sigma }_{\mathrm{int}}^{2}+{\left\langle \delta \right\rangle }^{2}}﹩. The values of σ, σint, and the median errors ﹩\left\langle \delta \right\rangle ﹩ are given in each panel.
Other Images in This Article


Show More
Copyright and Terms & Conditions
© 2019. The American Astronomical Society. All rights reserved.