Image Details
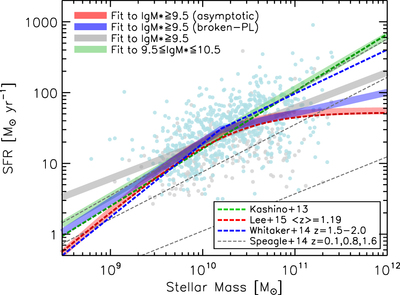
Caption: Figure 32.
Best-fit M* vs. SFR relations for the FMOS objects, in comparison to literature measurements. Pale colored circles indicate FMOS objects (same as in Figure 31). Thick solid curves indicate the best-fit relations to the FMOS data: power-law fits to objects with ﹩\mathrm{log}{M}_{* }/{M}_{\odot }\geqslant 9.6﹩ (gray) and ﹩9.6\,\leqslant \mathrm{log}{M}_{* }/{M}_{\odot }\leqslant 10.6﹩ (green), asymptotic function fit (red), and broken power-law fit (blue). Colored dashed lines indicate literature measurements: fit to a subset of the FMOS sample (Kashino et al. 2013; green), broken power-law fit at ﹩1.5\leqslant z\leqslant 2.0﹩ from Whitaker et al. (2014; blue), and asymptotic function fit at median ﹩\left\langle z\right\rangle =1.19﹩ from Lee et al. (2015; red). Three dashed gray lines indicate an empirically parameterized relation at z = 0.1, 0.8, and 1.6 (top to bottom) derived by Speagle et al. (2014).
Other Images in This Article


Show More
Copyright and Terms & Conditions
© 2019. The American Astronomical Society. All rights reserved.