Image Details
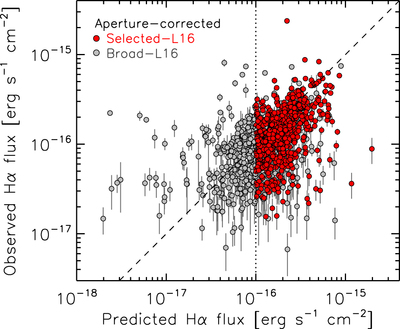
Caption: Figure 26.
Observed (aperture-corrected) vs. predicted Hα flux. Gray circles indicate objects in the Broad-L16 sample, while red circles indicate objects in the Selected-L16 sample. No error estimates are given for the predicted Hα flux. The vertical dotted line indicates the threshold ﹩{F}_{{\rm{H}}\alpha }^{\mathrm{pred}}={10}^{-16}\,\mathrm{erg}\,{{\rm{s}}}^{-1}\,{\mathrm{cm}}^{-2}﹩ for the Selected-L16 sample, and the dashed line indicates the one-to-one relation.
Other Images in This Article


Show More
Copyright and Terms & Conditions
© 2019. The American Astronomical Society. All rights reserved.
Copyright ©
2025 Astronomy Image Explorer. All Rights Reserved.