Image Details
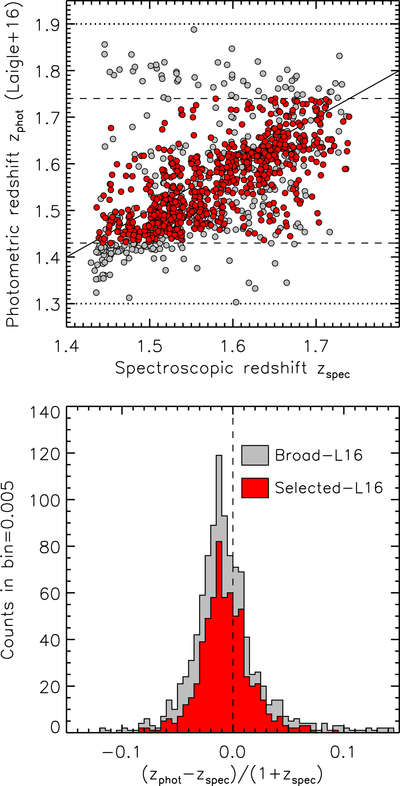
Caption: Figure 25.
Upper panel: comparison of spectroscopic and photometric redshifts. Gray circles indicate the objects in the Broad-L16 sample, while red circles indicate the objects in the Selected-L16 sample. The solid line indicates the one-to-one relation. Horizontal dotted and dashed lines indicate the imposed limits on the photometric redshifts: ﹩1.3\leqslant {z}_{\mathrm{phot}}\leqslant 1.9﹩ for Broad-L16 and ﹩1.43\leqslant {z}_{\mathrm{phot}}\leqslant 1.74﹩ for Selected-L16. Lower panel: distribution of ﹩({z}_{\mathrm{phot}}-{z}_{\mathrm{spec}})/(1+{z}_{\mathrm{spec}})﹩ from the upper panel. Gray and red histograms indicate the objects from the Broad-L16 and Selected-L16 samples, respectively.
Other Images in This Article


Show More
Copyright and Terms & Conditions
© 2019. The American Astronomical Society. All rights reserved.