Image Details
Caption: Figure 24.
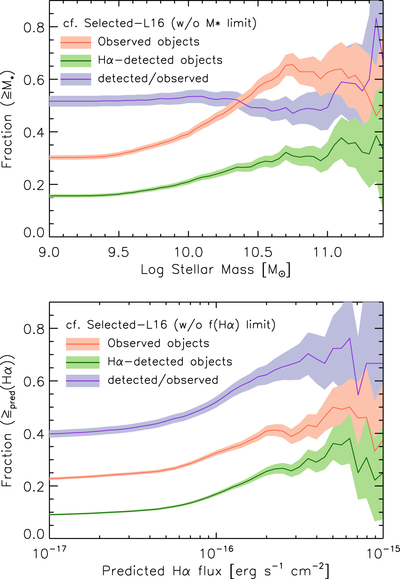
Cumulative sampling rate and success rate above a given M* (upper panel) and predicted Hα flux (lower panel). The red line indicates the sampling fraction of galaxies within the Selected-L16 sample but without the limit on the x-axis value in each panel. The green line indicates the fractions of the Hα-detected objects with respect to the Selected-L16 sample. The purple line indicates the cumulative success rate, which is the fraction of Hα-detected objects with respect to the observed galaxies above a given value.
Other Images in This Article


Show More
Copyright and Terms & Conditions
© 2019. The American Astronomical Society. All rights reserved.
Copyright ©
2025 Astronomy Image Explorer. All Rights Reserved.