Image Details
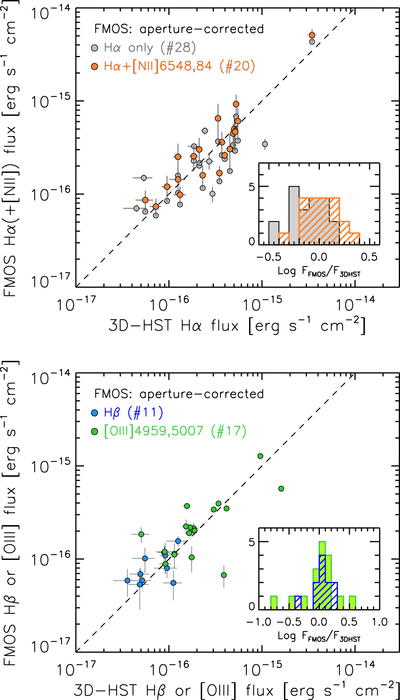
Caption: Figure 20.
Comparison of the fluxes of Hα (+[N II]) (upper panel) and Hβ and [O III] (lower panel) measured by FMOS and 3D-HST. The FMOS measurements are corrected for aperture loss. Gray circles indicate the Hα fluxes measured by FMOS, while orange circles indicate the Hα+[N II] λλ6548, 6584 fluxes to match the 3D-HST measurements, in which the Hα and [N II] lines are blended. Blue and green circles indicate Hβ and [O III] λλ4959, 5007 fluxes, respectively. Dashed lines indicate a one-to-one relation. Insets show the distribution of the FMOS–to–3D-HST flux ratios, color-coded the same as the symbols.
Other Images in This Article


Show More
Copyright and Terms & Conditions
© 2019. The American Astronomical Society. All rights reserved.
Copyright ©
2025 Astronomy Image Explorer. All Rights Reserved.