Image Details
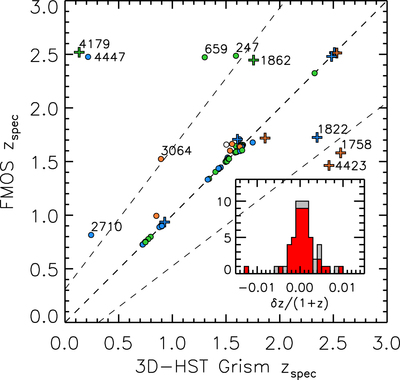
Caption: Figure 19.
Comparison between spectroscopic redshift measurements from FMOS and 3D-HST. Colors indicate the quality flag of the FMOS estimation: ﹩z\mathrm{Flag}=1\,(\mathrm{white})﹩, ﹩2\,(\mathrm{red})﹩, ﹩3\,(\mathrm{blue})﹩, and ﹩4\,(\mathrm{green})﹩. Circles and cross symbols correspond to the “good” and “warning” classes, respectively, according to the 3D-HST flags (see text). The middle dashed line indicates the one-to-one relation, while the other two dashed lines correspond to cases where, assuming the 3D-HST measurements are correct, the Hα line is misidentified as [O III] λ5007 (upper line) or [O III] is misidentified as Hα. Some objects are labeled (see text).
Other Images in This Article


Show More
Copyright and Terms & Conditions
© 2019. The American Astronomical Society. All rights reserved.