Image Details
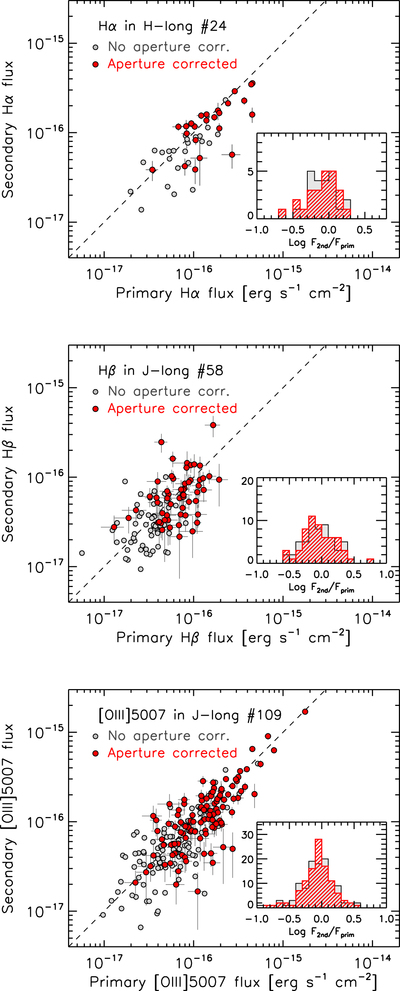
Caption: Figure 18.
Comparison of the best (primary) and second-best (secondary) measurements of the Hα flux in the H-long (top panel) and in the Hβ and [O III] λ5007 fluxes in the J-long window (middle and bottom panels) for the repeated objects. Red and gray circles indicate the observed fluxes with and without aperture correction. Inset panels show the distribution of the flux ratios ﹩\mathrm{log}({F}_{\mathrm{second}}/{F}_{\mathrm{primary}})﹩ before (gray histogram) and after (red hatched histogram) aperture correction.
Other Images in This Article


Show More
Copyright and Terms & Conditions
© 2019. The American Astronomical Society. All rights reserved.
Copyright ©
2025 Astronomy Image Explorer. All Rights Reserved.