Image Details
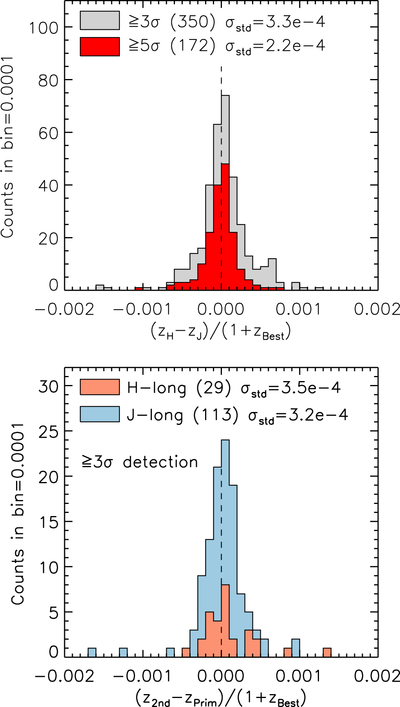
Caption: Figure 17.
Upper panel: distribution of ﹩({z}_{H}-{z}_{J})/(1+{z}_{\mathrm{best}})﹩, the difference between spectroscopic redshifts measured from Hα+[N II] detected in the H-long and Hβ+[O III] in the J-long spectra. The red histogram represents the subsample with a ≥5σ detection in both H-long and J-long spectra. Lower panel: distribution of ﹩({z}_{2\mathrm{nd}}-{z}_{\mathrm{prim}})/(1+{z}_{\mathrm{best}})﹩ (see text). Red and blue histograms correspond to the measurements in the H-long and J-long, respectively. Here the line detections are limited to be ≥3σ. In each panel, the values of standard deviation are denoted.
Other Images in This Article


Show More
Copyright and Terms & Conditions
© 2019. The American Astronomical Society. All rights reserved.