Image Details
Caption: Figure 15.
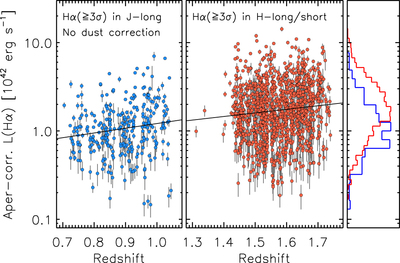
Observed Hα luminosity (corrected for aperture loss but not for dust extinction) as a function of redshift in the two redshift ranges, corresponding to the Hα detection in J-long (left panel) and H-long/short (middle panel). The solid lines indicate the linear regression being fitted independently in each redshift range. The histograms show the normalized distribution of LHα for each redshift range as color-coded (right panel).
Other Images in This Article


Show More
Copyright and Terms & Conditions
© 2019. The American Astronomical Society. All rights reserved.
Copyright ©
2025 Astronomy Image Explorer. All Rights Reserved.