Image Details
Caption: Figure 12.
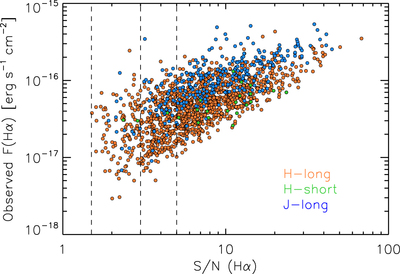
Observed Hα flux (corrected for neither aperture loss nor extinction) as a function of observed formal S/N for individual galaxies, shown separately for each spectral window as labeled. Vertical dashed lines indicate S/N = 1.5 (limit for detection), 3 (limit for zFlag = 2), and 5 (limit for zFlag = 3).
Other Images in This Article


Show More
Copyright and Terms & Conditions
© 2019. The American Astronomical Society. All rights reserved.
Copyright ©
2025 Astronomy Image Explorer. All Rights Reserved.