Image Details
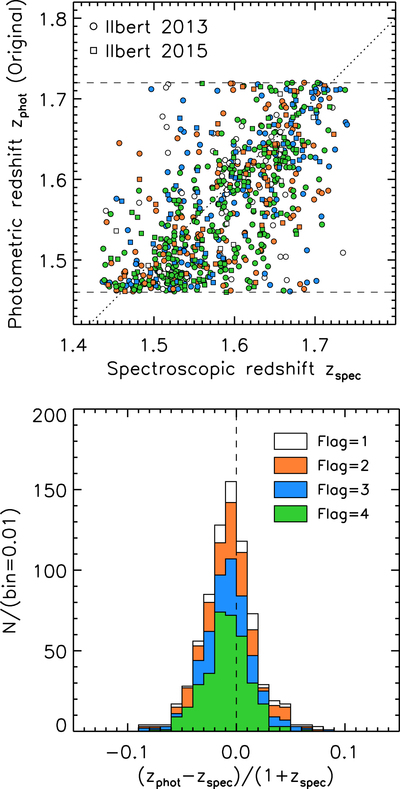
Caption: Figure 11.
Upper panel: comparison between zspec and zphot for the Primary-HL sample. Each point is color-coded by the quality flag of the redshift measurement, as labeled in the lower panel. Circles indicate the FMOS objects selected based on the photometric redshift from Ilbert et al. (2013), while squares indicate the objects based on Ilbert et al. (2015). Lower panel: distribution of the differences between the spectroscopic redshifts from FMOS and the photometric redshifts.
Other Images in This Article


Show More
Copyright and Terms & Conditions
© 2019. The American Astronomical Society. All rights reserved.
Copyright ©
2025 Astronomy Image Explorer. All Rights Reserved.