Image Details
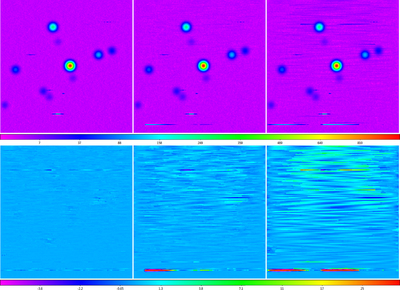
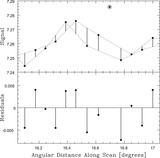
Caption: Figure 19.
Top row: data from Figure 18 background-subtracted, with 6 (left), 12 (middle), and 24 (right) beamwidth scales (the map is 24 beamwidths across). Bottom row: data from the top row (1) minus the data from Figure 16 (residuals) and (2) minus the Gaussian random noise residuals from the bottom row of Figure 14, and the small-scale structure residuals from the middle row of Figure 17 (for greater clarity). En-route drift and long-duration RFI are not eliminated, but are significantly reduced, especially in the smaller background-subtraction scale maps (see Figure 20). These gains are furthered, and again significantly, by our RFI-subtraction algorithm in Section 3.6.3. Locally modeled surfaces (Section 1.2.1; see Section 3.7) have been applied for visualization only. Square-root and hyperbolic arcsine scalings are used in the top and bottom rows, respectively, to emphasize fainter structures.
Other Images in This Article


Show More
Copyright and Terms & Conditions
© 2019. The American Astronomical Society. All rights reserved.