Image Details
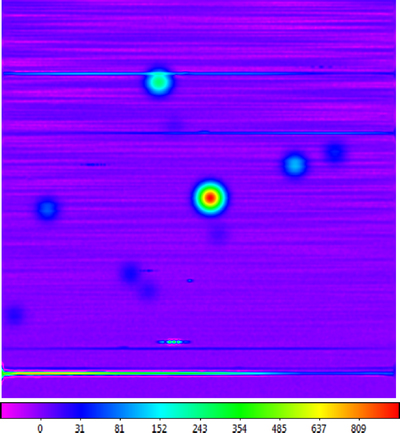
Caption: Figure 18.
Simulated data from Figure 16 to which we have added en-route drift and long-duration RFI. For the en-route drift, we use a sum of randomly phased sine functions, the shortest period of which is 12 beamwidths. We linearly increase the maximum amplitude of the en-route drift from zero times the noise level at the bottom of the image to 12 times the noise level at the top of the image. For the long-duration RFI, we use a similarly constructed sum of sine functions, plus a constant to ensure that it is always positive and multiplied by a long-duration Gaussian envelope. The long-duration RFI is significantly brighter than the en-route drift. A locally modeled surface (Section 1.2.1, see Section 3.7) has been applied for visualization only. Square-root scaling is used to emphasize fainter structures.
Other Images in This Article


Show More
Copyright and Terms & Conditions
© 2019. The American Astronomical Society. All rights reserved.