Image Details
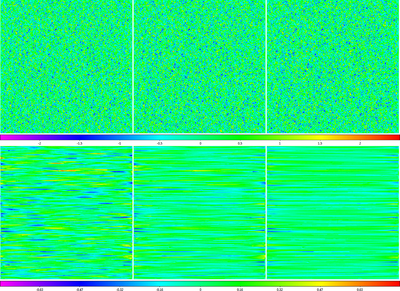
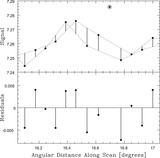
Caption: Figure 14.
Top row: data from Figure 13 background-subtracted, with 6 (left), 12 (middle), and 24 (right) beamwidth scales (the map is 24 beamwidths across). Bottom row: data from the top row minus the data from Figure 13 (residuals). Background-subtracted data are biased neither high nor low. To first order, the noise level of the background-subtracted data is ≈98.0% (left), ≈98.8% (middle), and ≈99.3% (right) that of the original data, and the rms of the residuals is only ≈20.1% (left), ≈15.4% (middle), and ≈12.3% (right) of the noise level of the original data (see Figure 15 for second-order effects). Locally modeled surfaces (Section 1.2.1; see Section 3.7) have been applied for visualization only.
Other Images in This Article


Show More
Copyright and Terms & Conditions
© 2019. The American Astronomical Society. All rights reserved.