Image Details

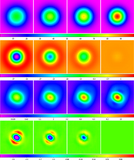
Caption: Figure 16.
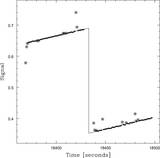
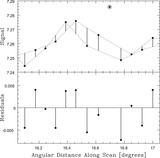
Simulated data from Figure 13 to which we have added point sources and short-duration RFI. For the point sources, we use a Gaussian beam pattern. For the short-duration RFI, we use the absolute value of a sum of rapidly varying sine functions multiplied by a short-duration Gaussian envelope function. A locally modeled surface (Section 1.2.1; see Section 3.7) has been applied for visualization only. Square-root scaling is used to emphasize fainter structures.
Copyright and Terms & Conditions
© 2019. The American Astronomical Society. All rights reserved.


