Image Details
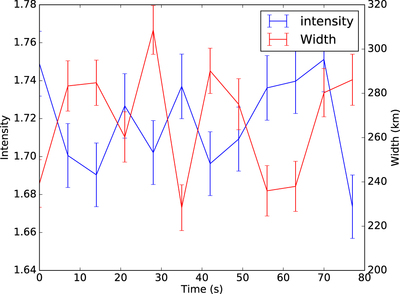
Caption: Figure 7.
Example of a clear anti-correlation between oscillations in maximum intensity (blue line) and width (red line) of the sample SCF in Figure 4, at the location marked by the white arrow in the lowest panel of that figure. The error bars represent the standard deviations of the photon counts for the intensity and the uncertainties of the Gaussian fitting to the cross-section of the fibril for the width.
Other Images in This Article

Copyright and Terms & Conditions
© 2017. The American Astronomical Society. All rights reserved.
Copyright ©
2025 Astronomy Image Explorer. All Rights Reserved.