Image Details
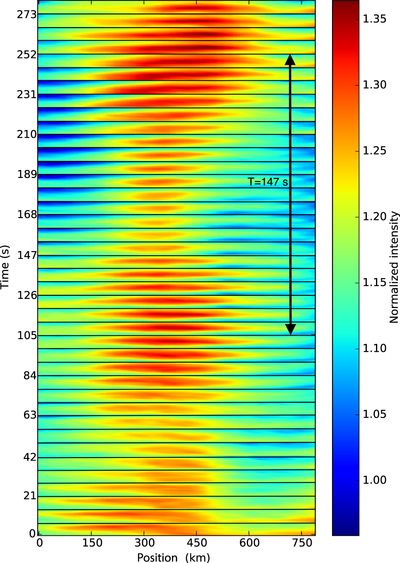
Caption: Figure 3.
Temporal variation of an SCF. The images of a straightened fibril at different times are vertically stacked. Individual images, recorded every 7 s, are separated by horizontal black lines. The vertical arrow indicates the period of the fibril’s intensity fluctuation. The color represents intensity, normalized to the mean value of the quiet region marked in Figure 1.
Other Images in This Article
Copyright and Terms & Conditions
© 2017. The American Astronomical Society. All rights reserved.
Copyright ©
2025 Astronomy Image Explorer. All Rights Reserved.