Image Details
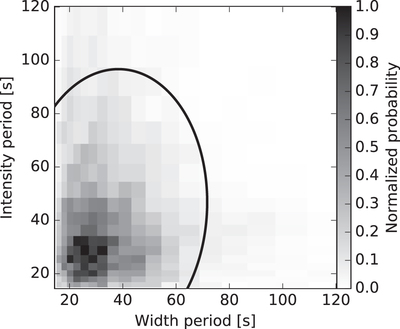
Caption: Figure 5.
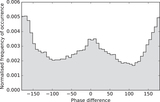
Two-dimensional histogram showing the relation between the periods of the width and the intensity oscillations in SCFs. The bin size follows the period resolution that is limited by the lifetime of the fibrils. The black curved line indicates the 95% confidence level.
Other Images in This Article

Copyright and Terms & Conditions
© 2017. The American Astronomical Society. All rights reserved.
Copyright ©
2025 Astronomy Image Explorer. All Rights Reserved.