Image Details
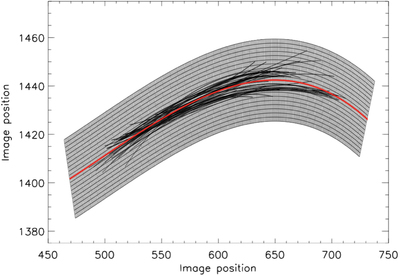
Caption: Figure 2.
Illustration of backbones of a sample SCF (at different times and averaged) and the grid associated with the SCF. The individual backbones of this fibril determined in the images recorded at different times are represented by the individual black lines. The reference backbone is represented by the red line and the mesh is shown by the black grid.
Other Images in This Article

Copyright and Terms & Conditions
© 2017. The American Astronomical Society. All rights reserved.
Copyright ©
2025 Astronomy Image Explorer. All Rights Reserved.