Image Details
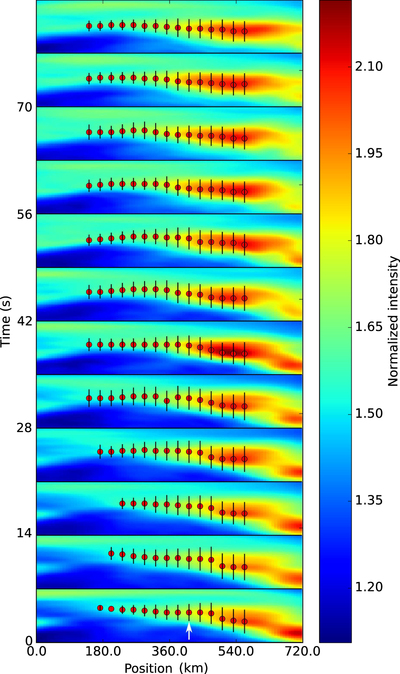
Caption: Figure 4.
Example of intensity maxima and width detections along cuts perpendicular to the axis of an SCF. Plotted are vertically stacked images of a fibril recorded in Ca II H observed at different times. Individual images, recorded every 7 s, are separated by horizontal black lines. The red dots within a given image represent the locations of the fibril’s maximum intensity along a series of cuts roughly perpendicular to the backbone of the fibril, while the vertical black lines indicate the width of the fibril at the same locations. The color represents intensity, normalized to the mean value of the quiet region in the SUFI frame (marked in Figure 1). The white arrow in the lower part of the bottom image marks the location at which the oscillations plotted in Figure 7 occurred. Note that this fibril is not the same as presented in Figure 3.
Other Images in This Article

Copyright and Terms & Conditions
© 2017. The American Astronomical Society. All rights reserved.