Image Details
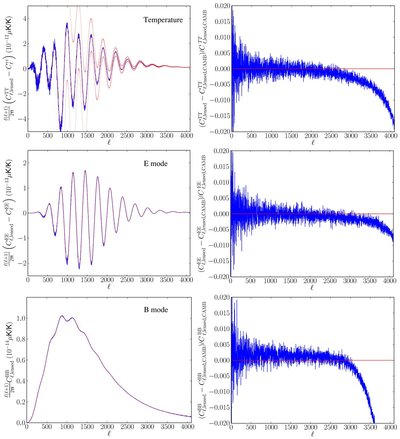
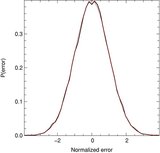
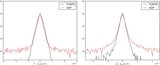
Caption: Figure 8.
Precision of lensed power spectra. We show the differences between the lensed spectra and the unlensed spectra for ~350 realizations of CMB fluctuations and lensing potentials. In the left panels, the dashed, red line is the difference as computed by CAMB, and the solid, blue line the result obtained using our interpolation technique. Cosmic variance error bars are shown as a dotted line in the top leftmost panel. In the right panels, we represented the relative difference between the CAMB prediction and the Flints prediction. We represented the change in the C ℓ for the temperature (top row), the E polarization mode (middle row), and the B polarization mode (bottom row). The fluctuations are here normalized by the CMB temperature and are unitless. The red lines in the right panels represent perfect agreement with CAMB. The lensed maps were computed using a CMB map at N side= 4096, ℓ max= 5000, and nine neighbors.
Other Images in This Article

Copyright and Terms & Conditions
© 2010. The American Astronomical Society. All rights reserved.