Image Details
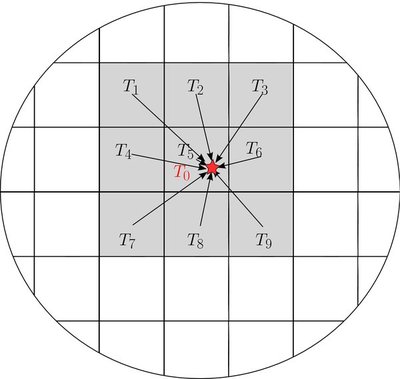
Caption: Figure 1.
Illustration of our interpolation procedure. We present here an illustration of the procedure. To get the value of the field interpolated at the position illustrated by the red star, we use the value of this field sampled on the grid given by the squares. In this setting, only the nine nearest neighbors, with temperature value T i , contribute to the value T 0.
Other Images in This Article

Copyright and Terms & Conditions
© 2010. The American Astronomical Society. All rights reserved.
Copyright ©
2025 Astronomy Image Explorer. All Rights Reserved.