Image Details
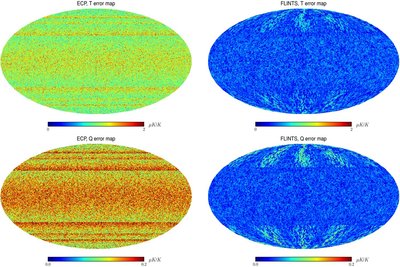
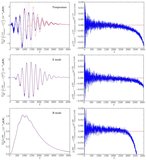
Caption: Figure 7.
Error distribution of the equi-cylindrical projection interpolation and of Flints on the sky. We represent a comparison of the error distribution on the sky of the interpolated temperature ( T, top panels) and one polarization plane ( Q, bottom panels) map. The errors in the ECP interpolation are represented in the left panels. The errors of the Flints interpolation are represented in the right panels. We compare to the exact lensing method. All maps were computed at N side = 1024, with ℓ max = 2048. For visualization purposes, we degraded the error maps to a resolution of N side = 128.
Other Images in This Article

Copyright and Terms & Conditions
© 2010. The American Astronomical Society. All rights reserved.