Image Details
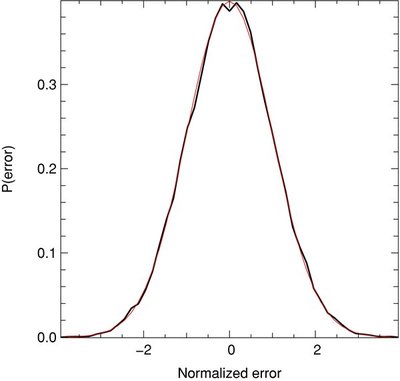
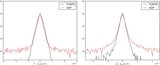
Caption: Figure 5.
Accuracy of the error estimate. The thick black line shows the measured error normalized using the error estimate, Equation (16), at each pixel. The overplotted thin red line is a Gaussian distribution of width 1 and centered on 0 showing perfect agreement between the predicted and actual errors.
Other Images in This Article

Copyright and Terms & Conditions
© 2010. The American Astronomical Society. All rights reserved.
Copyright ©
2025 Astronomy Image Explorer. All Rights Reserved.