Image Details
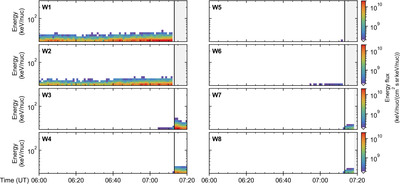
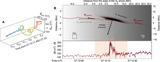
Caption: Figure 7.
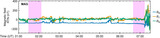
Ion energy fluxes measured by EPI-Lo ChanT, the full time-of-flight data. The vertical line indicates the moment of the in situ shock’s arrival. Gray shaded areas in the graph represent intervals where data were not available.
Other Images in This Article

Copyright and Terms & Conditions
© 2024. The Author(s). Published by the American Astronomical Society.
Copyright ©
2025 Astronomy Image Explorer. All Rights Reserved.