Image Details
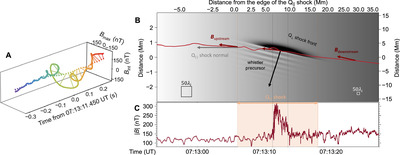
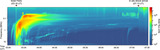
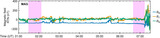
Caption: Figure 4.
Transition region of the quasi-parallel shock. Panel (A) displays the time evolution (depicted by the colors blue to red) of the transversal magnetic field components. The dotted line through the middle represents the mean field, B 0. Panel (B) illustrates a 2D schematic of the shock transition in the plasma frame. The spatial scales are in λ i (represented with 50λ i × 50λ i squares) and are estimated for the upstream and downstream separated at the edge of the quasi-parallel shock (Q ∥). The gray scale represents the change in B across the shock. The direction of B and the shock normal are also marked by arrows. The dark stripes in the middle represent the quasi-perpendicular structure at the ramp and the whistler precursors. Panel (C) presents the magnetic field magnitude upon which the schematic is based.
Other Images in This Article

Copyright and Terms & Conditions
© 2024. The Author(s). Published by the American Astronomical Society.