Image Details
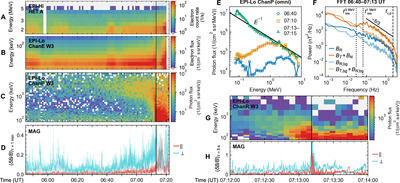
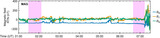
Caption: Figure 2.
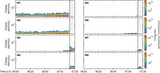
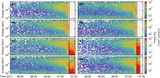
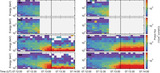
Energetic particles and the evolution of the wave foreshock. Panels (A)–(D) show the time–energy plots for high-energy electron counts detected by EPI-Hi, low-energy electron flux from EPI-Lo, proton flux from EPI-Lo, and the amplitude of transversal (⊥) and parallel (∥) magnetic fluctuations. In panel (E), we present the proton intensity spectra for three selected times (06:40, 07:10, and at the shock, averaged as 07:13–07:15 UT) with an E −1 power law shown for reference, which indicates the changes in energetic particle distribution. Panel (F) shows the Fourier power spectra of B R (estimating B ∥ power) and the sum of B T and B N (estimating B ⊥ power) in the foreshock and the background. Variations in the proton flux and magnetic fluctuations over a 2 minute period surrounding the shock transition are shown in panels (G) and (H).
Other Images in This Article

Copyright and Terms & Conditions
© 2024. The Author(s). Published by the American Astronomical Society.