Image Details
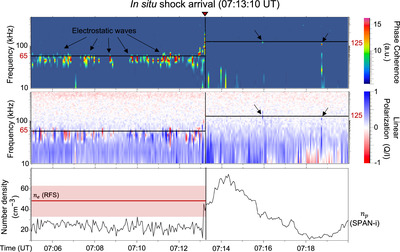
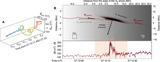
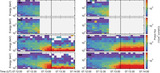
Caption: Figure 5.
In situ arrival of the shock as observed through high-frequency electric field data from the FIELDS/RFS. The top panel displays the coherence spectra, while the middle panel presents the normalized linear polarization, Stokes Q/I. The estimated upstream and downstream plasma frequencies (ω pe) are indicated by horizontal black lines, with arrows highlighting the observed electrostatic waves. The bottom panel juxtaposes the estimated electron density (n e)—with the range of uncertainty depicted as a red shaded area—against the ion density measured by SPAN-i.
Other Images in This Article
Copyright and Terms & Conditions
© 2024. The Author(s). Published by the American Astronomical Society.