Image Details
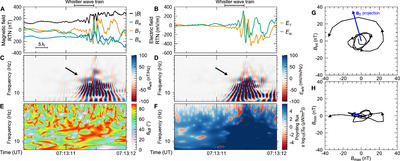
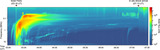
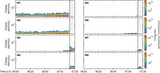
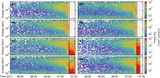
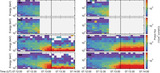
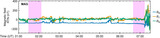
Caption: Figure 3.
Analysis of the waves at the shock transition. Panels (A) and (B) show the magnetic and electric field components. The duration of the precursor whistlers (between 07:13:11.10 and 07:13:11.45) is annotated on top. Panel (A) also indicates the approximate spatial scale of the upstream in units of λ i estimated in the plasma frame. Panels (C) and (D) show the Morlet wavelet spectrum of the magnetic and electric fields. The θ kB angle between the wavevector k and the magnetic field B is shown in panel (E). In panel (F), we show the Poynting flux estimated in the spacecraft frame S sc. Finally, the hodographs of precursor whistler waves in the maximum vs. intermediate variance plane and the maximum vs. minimum variance planes are presented in panels (G) and (H), respectively. In both panels, the blue arrow denotes the mean field B 0.
Other Images in This Article

Copyright and Terms & Conditions
© 2024. The Author(s). Published by the American Astronomical Society.