Image Details
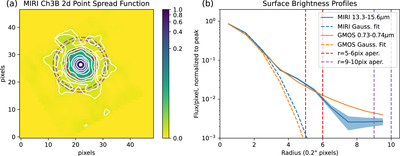
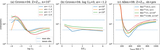
Caption: Figure 7.
(a) MIRI Channel 3B point-spread function. White contours are spaced by factors of 2 in surface brightness from 0.512 times the peak flux to 0.002 of peak. The dashed red and purple lines mark two apertures used in the radial profile computation. (b) Radial surface brightness profiles of the MIRI and GMOS data, normalized to the 2D peak flux. The profiles are Gaussian within 3 pixels, with FWHM = 0.″62–0.″65. They have non-Gaussian wings carrying ∼10%–15% power. The 1σ error in the MIRI profile is represented by the shaded area. The apertures shown in (a) are delineated by the vertical dashed lines.
Other Images in This Article

Copyright and Terms & Conditions
© 2023. The Author(s). Published by the American Astronomical Society.
Copyright ©
2025 Astronomy Image Explorer. All Rights Reserved.