Image Details
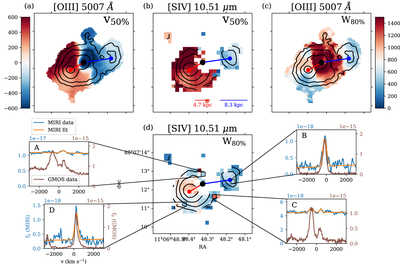
Caption: Figure 2.
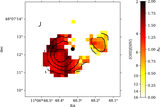
(a) [O III] v med from Gemini–GMOS observations (Shen et al. 2023). Surface brightness contours begin at 5 × 10⁻¹⁵ erg s−1 cm−2 arcsec−2 and descend by factors of 2. The quasar is indicated with a black circle. (b) [S IV] v 50%, in km s−1, with surface brightness contours as in Figure 1. The [S IV] surface brightness peaks are plotted as red and blue circles, and they are connected to the quasar by red and blue lines. The lengths of these lines are indicated below. The velocity scale is identical to panel (a). (c) [O III] W 80%. Note the N-to-SW band of high W 80% that is not present in [S IV]. (d) [S IV] W 80%. The velocity scale is identical to panel (c). Insets show MIRI and GMOS spectra in several representative spaxels with fits to the MIRI data overlaid. Flux densities are in erg s−1 cm−2 Å−1 arcsec−2. The left-side y-axis shows MIRI f λ ; the right-side y-axis is GMOS f λ .
Other Images in This Article

Copyright and Terms & Conditions
© 2023. The Author(s). Published by the American Astronomical Society.