Image Details
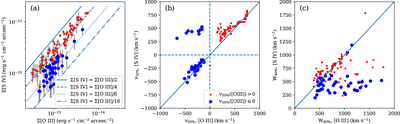
Caption: Figure 3.
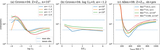
(a) [S IV] vs. [O III] surface brightnesses. Spaxels with [O III] v 50% > 0 km s−1 are in red; blueshifted spaxels are in blue. Lines of constant flux ratios are overplotted. Blueshifted spaxels have lower [O III]/[S IV]. Gray lines represent 1σ error bars. (b) [S IV] vs. [O III] v 50%. The diagonal solid line is a line of equality; the dashed lines locate v = 0 km s−1. Several points show blueshifted [O III] compared to [S IV]; these are in the N-to-SW band of the nebula where the red and blue sides of the outflow overlap and only one component of [S IV] is detected. Uncertainties are of order 10 s of km s−1. (c) [S IV] vs. [O III] W 80%. The solid line shows equality. Again, spaxels with larger [O III] W 80% compared to [S IV] indicate locations where more [O III] components are detected, and also where a faint, broad base of the line is undetected in [S IV]. Uncertainties are of order 100 km s−1.
Other Images in This Article
Copyright and Terms & Conditions
© 2023. The Author(s). Published by the American Astronomical Society.