Image Details
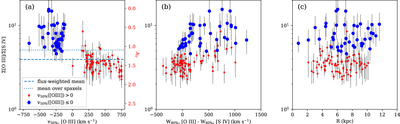
Caption: Figure 4.
(a) [O III]/[S IV] line ratio vs. [O III] median velocity. A significant correlation is evident (r = − 0.75), suggesting differential attentuation with velocity. Spaxels with [O III] v 50% > 0 km s−1 are in red; blueshifted spaxels are in blue. The right-side axis shows extrapolated extinction A V , assuming an intrinsic line ratio of 16—the maximum observed in the data—and the Chiar & Tielens (2006) extinction curve. Horizontal lines show average line ratios. (b) [O III]/[S IV] vs. line width difference W 80%([O III]) − W 80%([S IV]); a milder correlation is present. (c) [O III]/[S IV] vs. projected galactocentric radius. Although one might expect stronger differential extinction effects closer to the nucleus, no correlation is evident.
Other Images in This Article

Copyright and Terms & Conditions
© 2023. The Author(s). Published by the American Astronomical Society.