Image Details

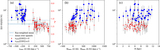
Caption: Figure 5.
(a) [O III]/[S IV] line ratio vs. ionization parameter U 0 and spectral index α. These dusty, radiation-pressure-dominated photoionization models (Groves et al. 2004) have Z = Z ⊙ and n = 103 cm−3. The dashed and dotted lines show the maximum and mean observed line ratios. The high-ionization models predict ratios 2–3× lower than the maximum observed line ratios. (b) [O III]/[S IV] vs. metallicity and density for log U 0 = 0 and α = − 1.2. There is little variation with metallicity or density. (c) [O III]/[S IV] vs. shock velocity for the shock + precursor models of Allen et al. (2008) with varying magnetic parameter B/n 1/2 (in units of μG cm−3/2) and density n (in units of cm−3). The lowest- and highest-velocity shock+precursor models are consistent with the maximum observed ratios. However, the low-velocity models cannot reproduce the observed higher-ionization Ne line fluxes.
Other Images in This Article

Copyright and Terms & Conditions
© 2023. The Author(s). Published by the American Astronomical Society.