Image Details
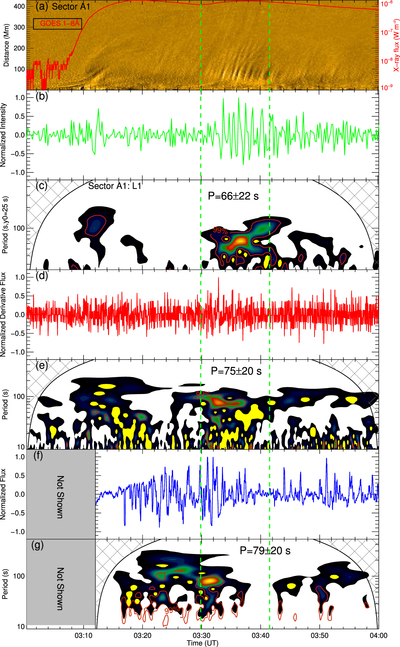
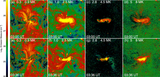
Caption: Figure 3.
(a) Time–distance plot of Sector A1, overlaid with the GOES X-ray flux. (b)–(c) Detrended emission intensity measured at L1 in Figure 2(a) and its wavelet spectrum. (d)–(e) Derivative of GOES X-ray flux and its wavelet spectrum. (f)–(g) Detrended RoRH 17 GHz radio emission flux and its wavelet spectrum. The radio data of NoRH 17 GHz started at about 03:12 UT. The two green vertical dashed lines highlight the time interval of QFP wave and periodic signal in the flaring core. The y0 indicates the initial value of the Y-axis in panel (c).
Other Images in This Article
Copyright and Terms & Conditions
© 2021. The American Astronomical Society. All rights reserved.
Copyright ©
2026 Astronomy Image Explorer. All Rights Reserved.