Image Details
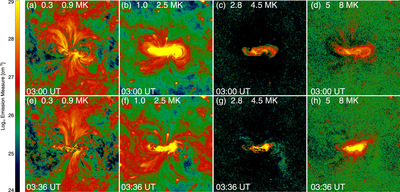
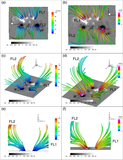
Caption: Figure 5.
DEM maps as a function of temperature. Panels (a)–(d) show the DEM maps before the flare eruption at 03:00 UT. Panels (e)–(h) present DEM maps during the QFP wave propagation at 03:36 UT.
Other Images in This Article
Copyright and Terms & Conditions
© 2021. The American Astronomical Society. All rights reserved.
Copyright ©
2026 Astronomy Image Explorer. All Rights Reserved.