Image Details
Caption: Figure 1.
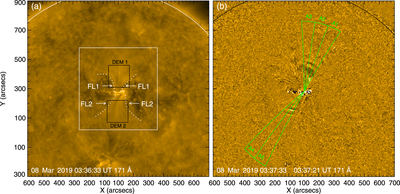
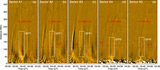
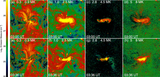
(a) AIA 171 Å image showing AR 12734 and the coronal funnels. Regions enclosed by DEM1 and DEM2 were used in the DEM analysis. FL1 and FL2 label the two coronal funnels used in this study. The white dotted lines indicate the borders of FL1 and FL2. The white rectangle indicates the region used in DEM analysis as shown in Figure 5. (b) Difference image of the AIA 171 Å channel to highlight wave propagation. An animation of this figure is available. It begins on 03:00:21 and ends at 04:04:21. The real-time duration of the animation is 6 s. Sectors A1–A5 were used to make time–distance plots shown in Figure 2.
(An animation of this figure is available.)
The video/animation of this figure is available in the online journal.
Other Images in This Article
Copyright and Terms & Conditions
© 2021. The American Astronomical Society. All rights reserved.