Image Details
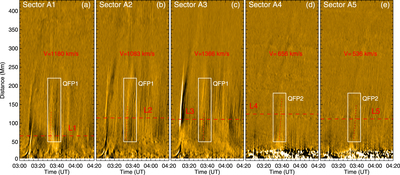
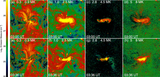
Caption: Figure 2.
(a)–(e) time–distance diagrams corresponding to sectors A1–A5. The QFP wave features are indicated by the boxes. The red-dashed lines mark the positions used in wavelet analysis for period measurement. Each red dotted line within a white rectangle follows a sample QFP wave front, its slope was used to measure the propagating speed.
Other Images in This Article
Copyright and Terms & Conditions
© 2021. The American Astronomical Society. All rights reserved.
Copyright ©
2026 Astronomy Image Explorer. All Rights Reserved.