Image Details
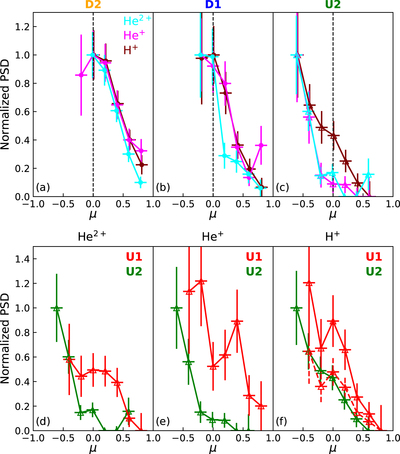
Caption: Figure 5.
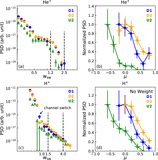
(a)–(c) Normalized PADs of ∼10–40 keV/nuc H+, He2+ and ∼8–20 keV/nuc He+ in “D2” (a), “D1” (b), and “U2” (c) indicated in Figure 2. The estimated statistical errors are shown. (d)–(f) Comparison of the PADs observed during the upstream intervals “U1” and “U2” for He2+ (d), He+ (e), and H+ (f). For each ion species, the PSDs in “U1” and “U2” are both normalized to the maximum PSD observed in “U2,” shown as solid lines. In order to compare the width of the H+ beam, the PSDs in “U1” are further normalized to the PSD at −0.5 < μ < −0.3 in “U2,” shown as the dashed line in (f). The estimated statistical errors are also shown.
Other Images in This Article
Copyright and Terms & Conditions
© 2020. The American Astronomical Society. All rights reserved.