Image Details
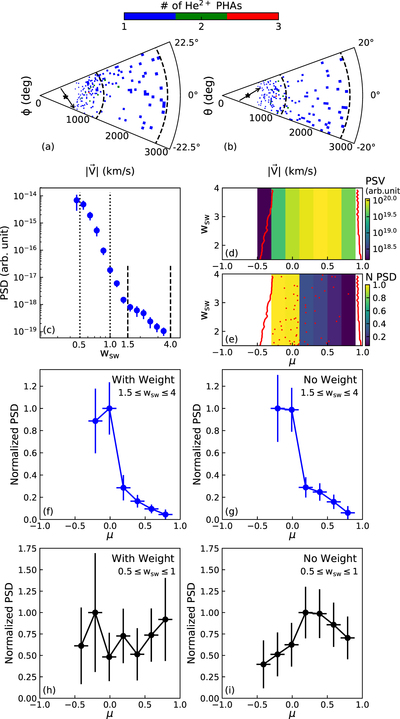
Caption: Figure 1.
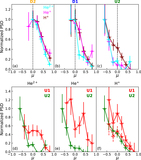
Distributions of He2+ PHA events in (a) and out of (b) the ecliptic plane, accumulated by the main channel of the SWS in a ∼10 minute time interval as an example for illustration. The star marks the average bulk velocity of solar wind protons, and the arrow indicates the average direction of magnetic field during this interval. (c) Average velocity distribution function of He2+ in this interval. The dotted lines indicate where wsw = 0.5 and wsw = 1, and the dashed lines in (a)–(c) indicate where wsw = 1.5 and wsw = 4. (d) Total PSV covered by all the combinations of ESA step, deflection step, and position bin that fall in each PA bin. (e) PSD in each PA bin, normalized to its maximum among all PA bins. The red contour lines in (d)–(e) indicate the PA coverage and the red dots in (e) represent the transmitted PHA events during this ∼10 minute interval. (f)–(g) Average PSD at 1.5 ≤ wsw ≤ 4 as a function of PA, normalized to its maximum among all PA bins and shown as a line plot with estimated statistical errors. The PSDs are obtained with applying the base rate weight in (d) and without in (e). (h)–(i) Similar to (f)–(g), but for 0.5 ≤ wsw ≤ 1. Note that the data shown in this figure are the same data as in the downstream interval “D1” shown in Figure 3.
Other Images in This Article
Copyright and Terms & Conditions
© 2020. The American Astronomical Society. All rights reserved.