Image Details
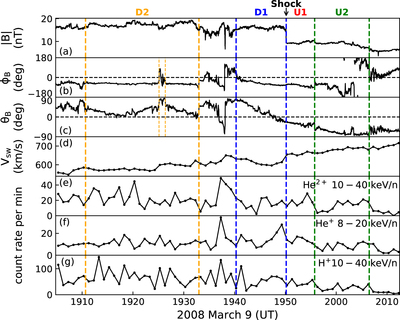
Caption: Figure 2.
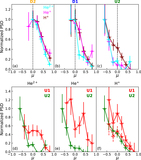
Summary plot of the reverse SIR shock on 2008 March 9. (a)–(c) Magnitude ﹩| B| ﹩, azimuthal angle ϕB, and elevation angle θB of IMF in 1 s resolution, (d) solar wind proton bulk velocity in 1 minute resolution. (e)–(g) Count rate per minute of ∼10–40 keV/nuc He2+, ∼8–20 keV/nuc He+, and ∼10–40 keV/nuc H+. The right blue line indicates the shock arrival at ∼1950 UT, and the bold colored lines mark the boundaries of the four periods analyzed in this study.
Other Images in This Article
Copyright and Terms & Conditions
© 2020. The American Astronomical Society. All rights reserved.
Copyright ©
2024 Astronomy Image Explorer. All Rights Reserved.