Image Details
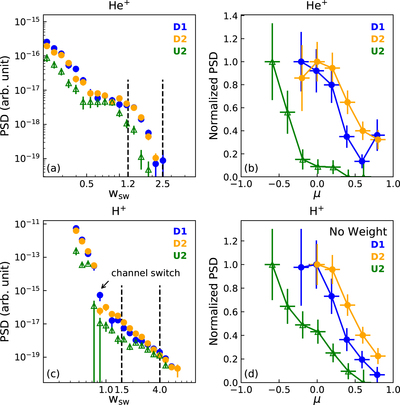
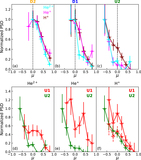
Caption: Figure 4.
(a)–(b) Average velocity distribution functions and normalized PADs (normalized to the maximum among all PA bins) of He+ observed by the SWS during “D1,” “D2,” and “U2” indicated in Figure 2; (c)–(d) same as (a)–(b), but for H+. The PADs are averaged over wsw ∼ 1.2–2.5 (dashed lines in (a)) for He+ and wsw ∼ 1.5–4 (dashed lines in (c)) for H+. The selected range of wsw ∼ 1.5–4 in (c) is far above the velocity of the small channel switch. The PSDs in (d) are obtained without applying the base rate weight. The estimated statistical errors are shown in each panel.
Other Images in This Article
Copyright and Terms & Conditions
© 2020. The American Astronomical Society. All rights reserved.
Copyright ©
2026 Astronomy Image Explorer. All Rights Reserved.