Image Details
Caption: Figure 5.
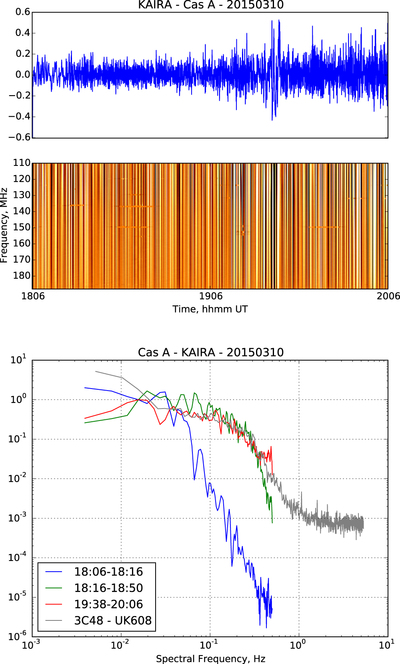
Median time series and dynamic spectrum (upper two plots) across the passband of data from an observation of Cassiopeia A taken using KAIRA on 2015 March 10. The dynamic spectrum is displayed using the scale −0.02 (dark) to 0.02 (light), arbitrary units. The lower plot presents example power spectra from different parts of the observation, as shown in the key. Also shown in gray is the UK608 power spectrum from the 18:30 to 19:00 UT segment of the LOFAR 3C48 observation of 2015 November 10 for comparison.
Other Images in This Article

Copyright and Terms & Conditions
© 2016. The American Astronomical Society. All rights reserved.
Copyright ©
2025 Astronomy Image Explorer. All Rights Reserved.