Image Details
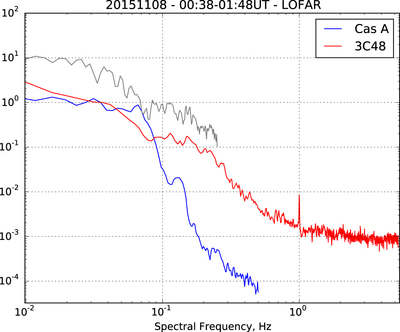
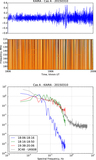
Caption: Figure 2.
Power spectra: 3C48 data from remote station RS406 are plotted in red; Cassiopeia A data from core station CS026 are plotted in blue. For ease of comparison these spectra were normalized such that the level is matched at the low spectral frequencies. Also plotted in gray, but shifted upward so that it does not confuse the other spectra, is a power spectrum of the 3C48 data averaged to a 2 s cadence.
Other Images in This Article
Copyright and Terms & Conditions
© 2016. The American Astronomical Society. All rights reserved.
Copyright ©
2025 Astronomy Image Explorer. All Rights Reserved.