Image Details
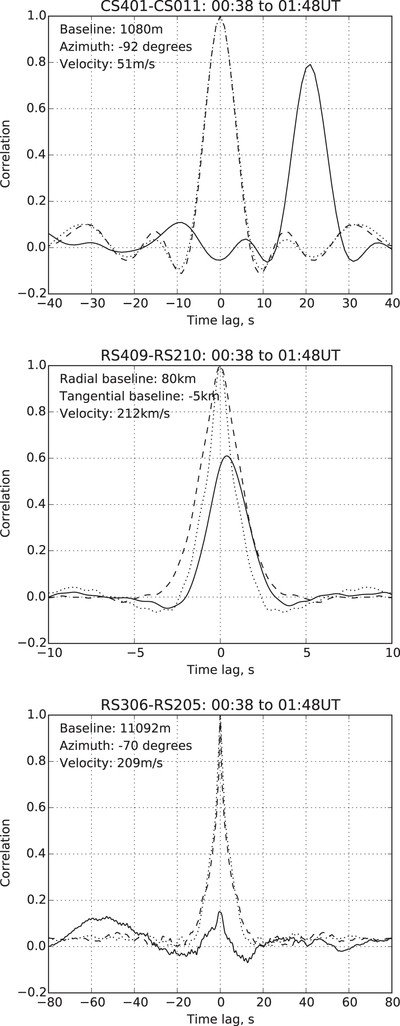
Caption: Figure 1.
Plots of auto- (dashed and dotted lines) and cross-correlation (solid line) functions of time series’ calculated from the observations of 2015 November 8, over the entire duration of the observations. Top: Cassiopeia A data from core stations CS401 and CS011; middle: 3C48 data from remote stations RS409 and RS210; bottom: 3C48 data from remote stations RS306 and RS205.
Other Images in This Article

Copyright and Terms & Conditions
© 2016. The American Astronomical Society. All rights reserved.
Copyright ©
2025 Astronomy Image Explorer. All Rights Reserved.